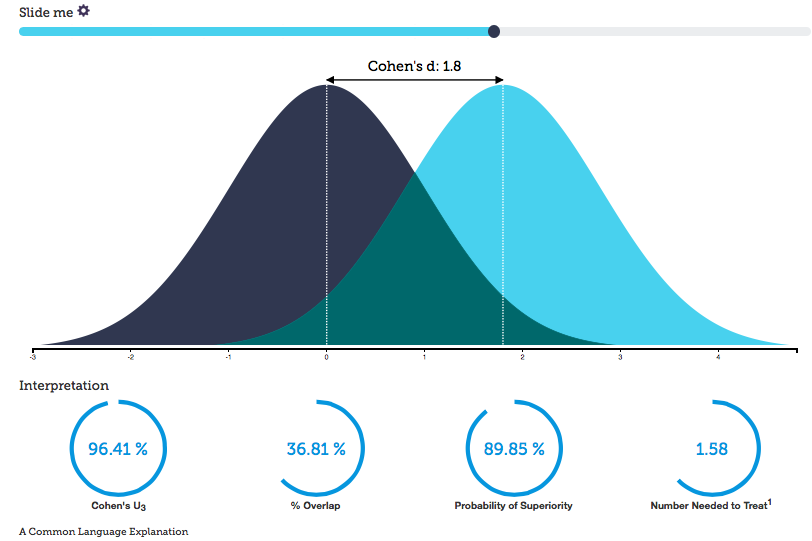
Kristoffer Magnussen has a neat blog about statistics and psychology at R <- Psychologist. In particular, he has a very useful visualization of a metric called Cohen’s d. Even if you know what that is, it’s very helpful to have a quick tool on hand without having to calculate anything. All of the visualization appears to be made from d3.js, which is becoming a standard for showing your data.

